Residential Lot Performance
2025
Client: Common Ground
Once Stage 1 of a project is rolling out to the market, all our good developers come back to us with the same question: How come our fabulous subdivision is getting trashed by bad buildings?!! To be fair, sometimes the houses are fine. It’s just that they’re unaware of what they’re sitting among and what’s required of them to protect the inherent design quality of the subdivision.
So, by popular request (as they say), we’ve recently been pushed to see if we can develop a tool that can measure the quality of lot design in the same way the RSP tool can measures subdivision design.
Read More
The big ‘learning’ to come out of this work was that the thing that made all the difference to built-form outcomes was the process of designing the buildings.
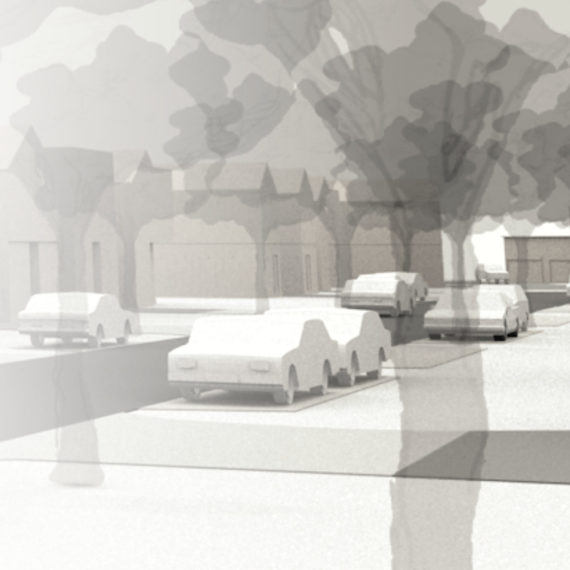
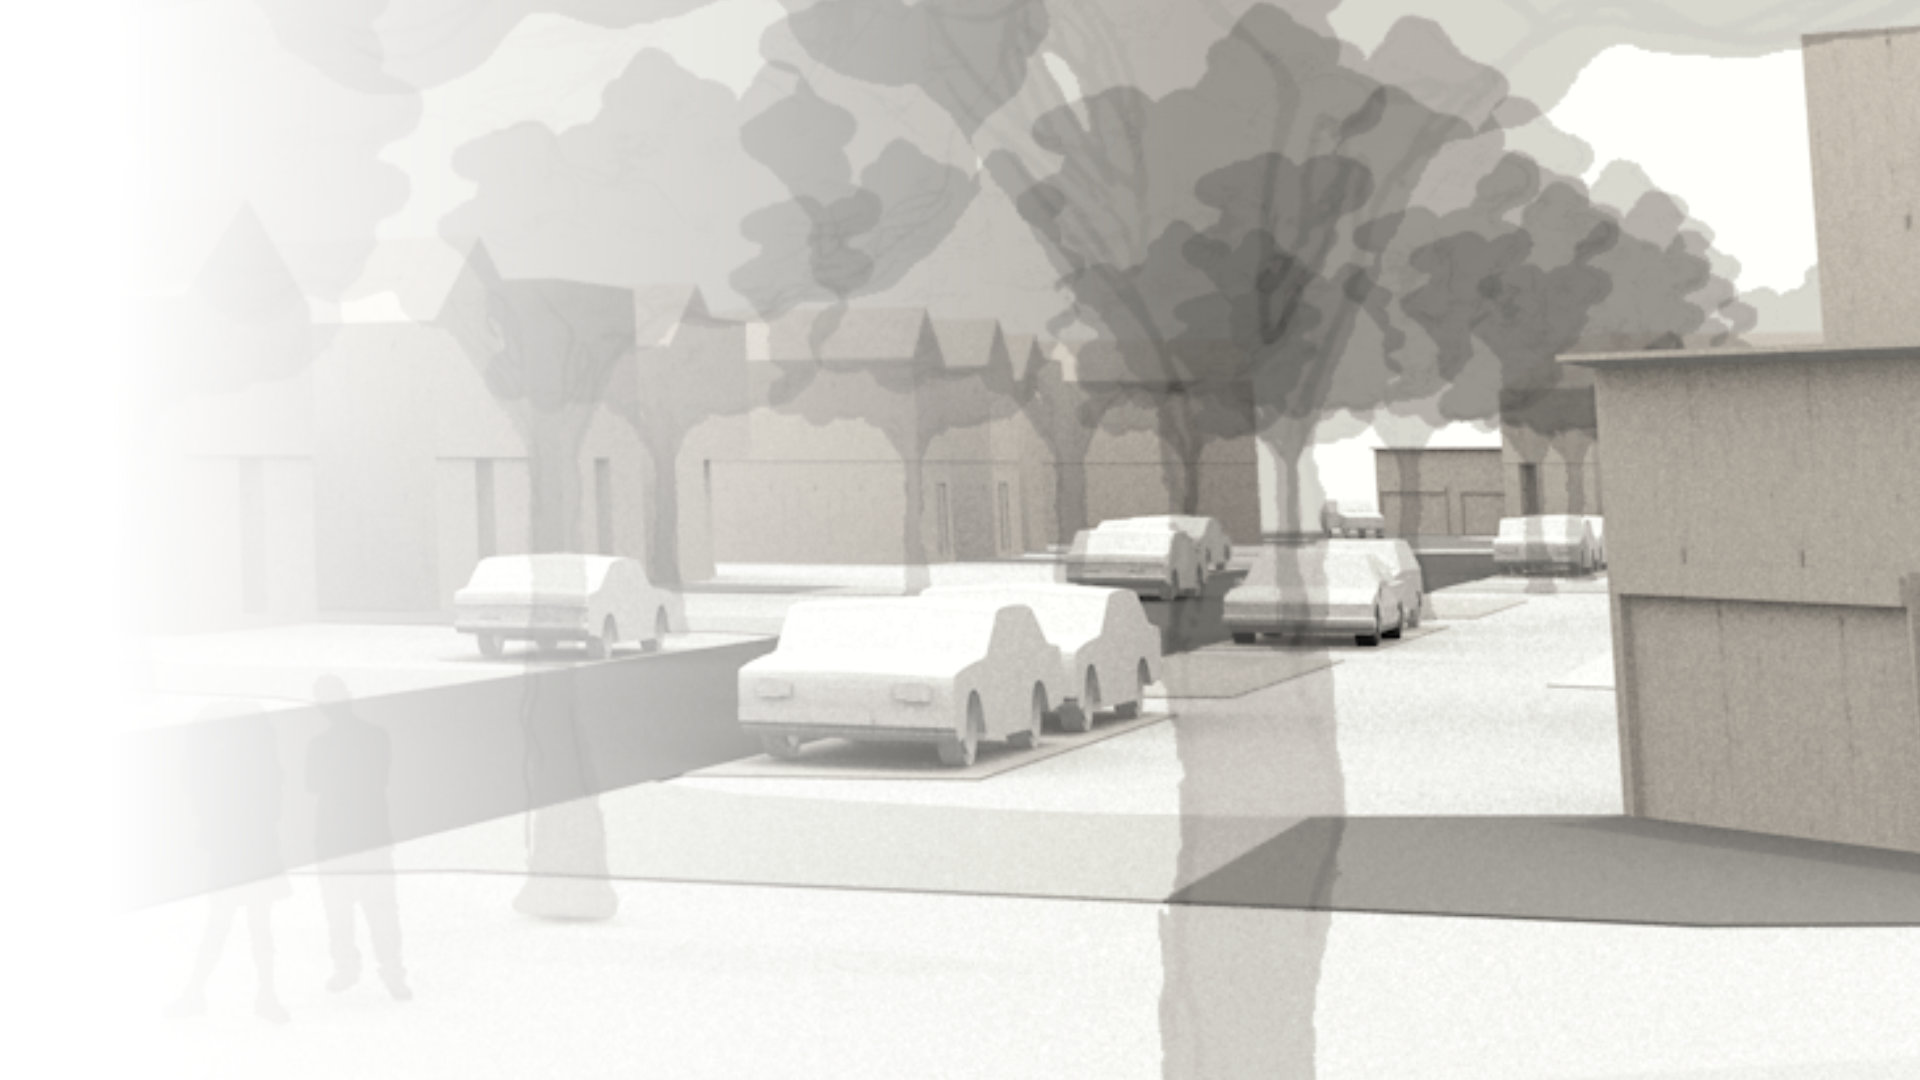
Typically when a house is designed as a one-off, inherent in the process is the possibility for it to respond to its setting – the lot, the planning rules, its urban context.
Stock designs, when prepared in the traditional way, don’t have that ability for infinitely variable response. At best, if there is a good selection of designs, you get a ‘best fit’ from what’s available. This model of stock design is predicated on the costs of achieving greater economy and efficiency for the builder being transferred to the public realm. In situations where urban value and functionality are very low, it could be argued that whether stock design or bespoke, it makes little difference in terms of public good outcome.
However, at medium density levels an unresponsive approach to house design no longer works. With smaller lot sizes and a different configuration of the public realm, the house has an elevated – and critical – role to play in managing the quality and functionality of the whole urban environment. It is possible for stock design to be responsive enough that high quality outcomes are possible, but it requires a different design process altogether. See Typology Design as an example.
How It Started
Chance, great friend that she is, dropped two things into our lap that we could use as development fodder.
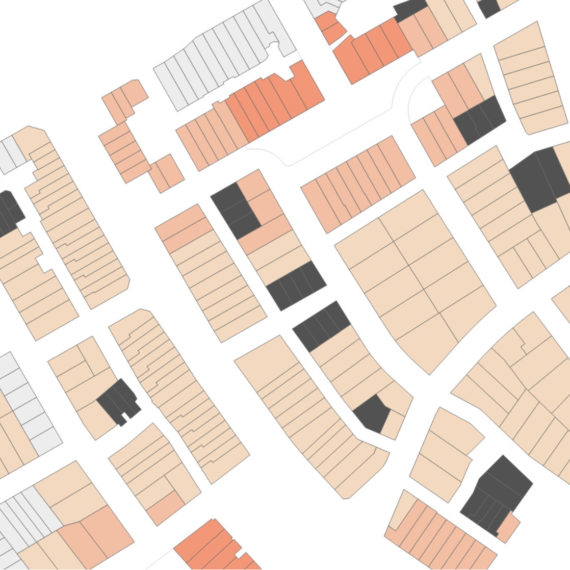
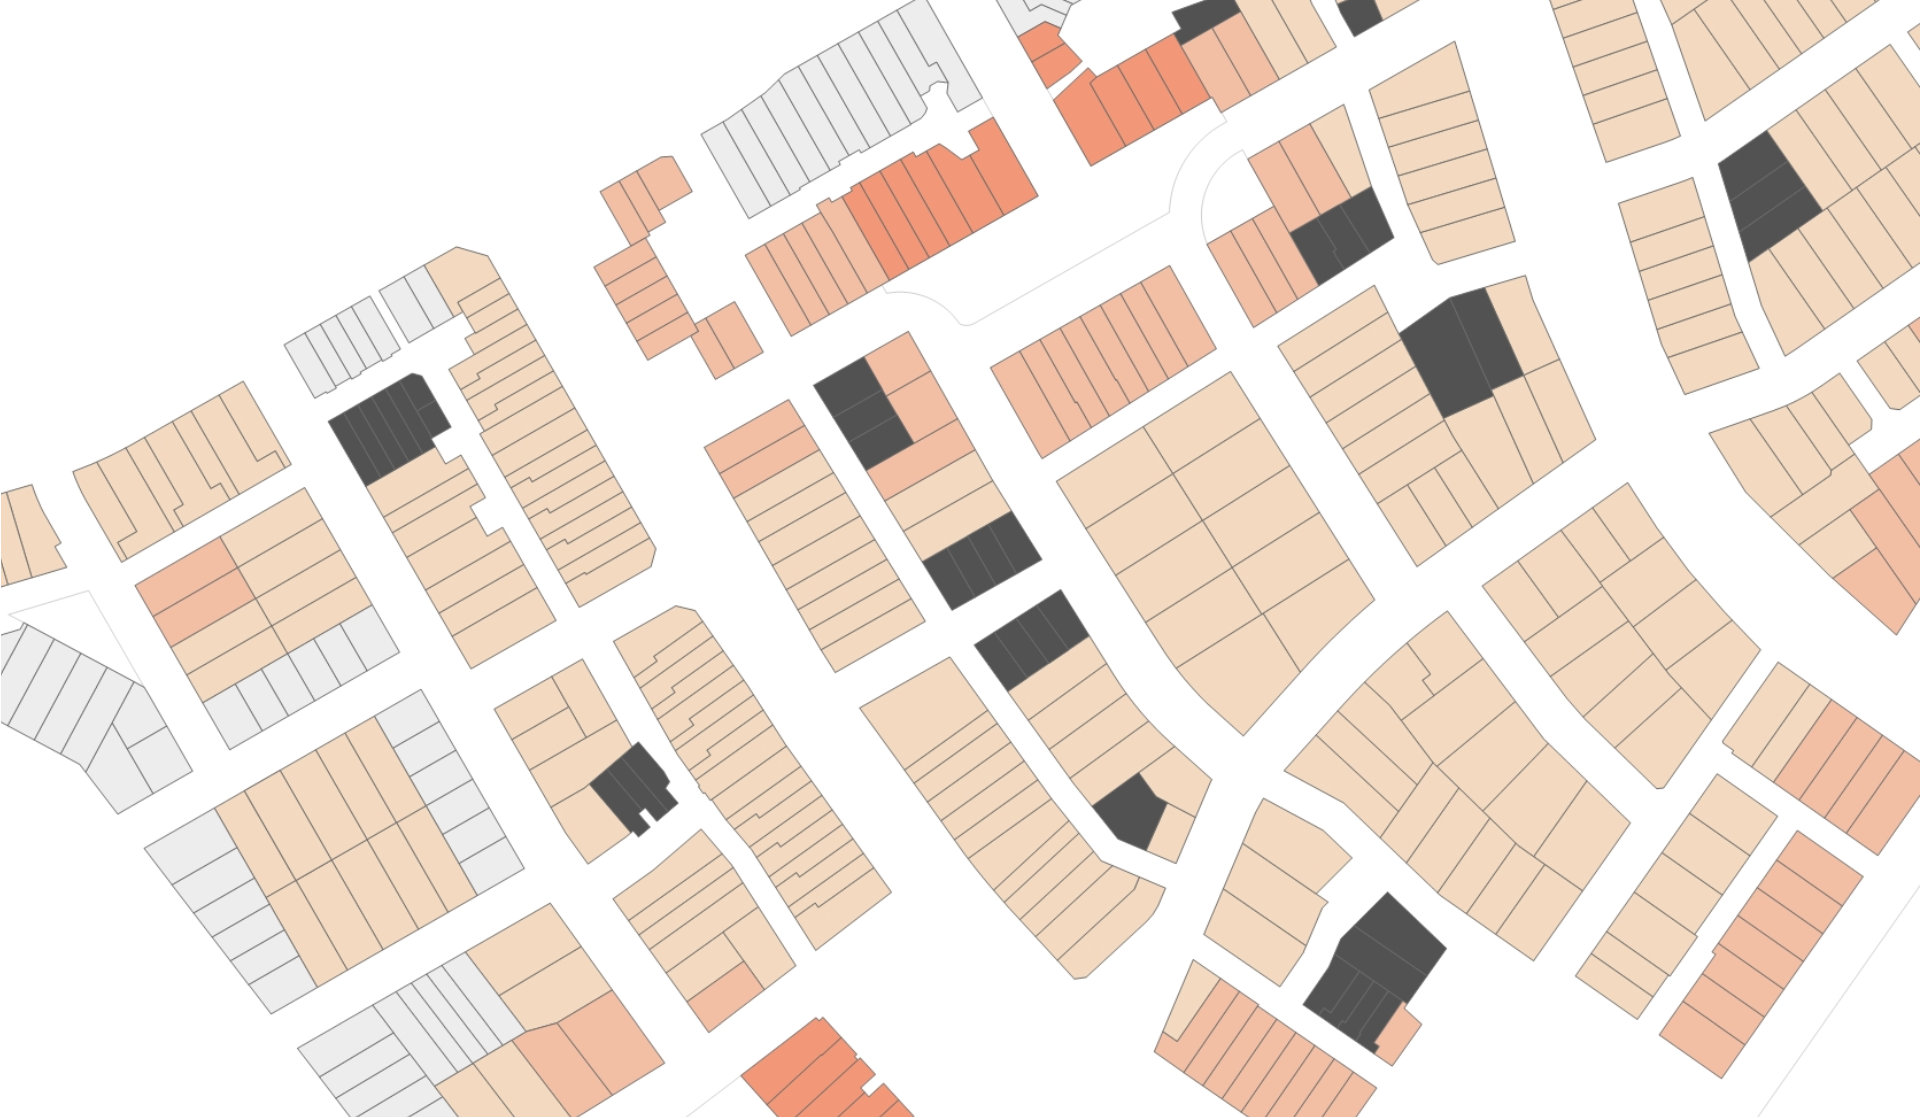
- For a proposed Exemplar development in Whangarei, WDC asked for a small (5 lot) full site design so they could better understand how everything worked together in relationship to the public realm.
- A builder supplying another development in Whangarei proposed a set of designs and layouts for a small half block (6 lots).
That development is a fairly high-performing subdivision designed with the same sort of modified rules and controls as the Exemplar. Therefore, also using pre-designed houses, we prepared an alternative scheme for the same lots to indicate what outcome should be anticipated, all things being equal (bedroom count, etc). This was a trivial exercise, taking only a few minutes. Once you have building designs (floorplans) you can map a spatial plan for the site. This is all that’s required for RLP analysis, and again, is a trivial exercise taking something like five minutes to map for both schemes.
RLP Detail
RLP analysis follows the same format as RSP ie research validated criteria are identified that can be represented by simple geometry.
Think of the geometry as a very basic spatial plan for the lot – a concept landscape plan if you will. Five different types of polygon and a marker for where the front door is are all that’s required.
Data records are attached to the 2D geometry.
Together with data drawn from Object properties (eg area, length, and so on), calculations are processed internally to populate all field values.
Output, as per the RSP tool, is the automatic generation of data visualisations as well as table data so that where effects are felt and by how much can be intuitively read and interrogated. The scoring schema of the WFUE and RSP tools has also been adopted, not only because it has proved itself in those tools but also to maintain a kind of parity among them since their purposes are related and their .
To recap, scores range from -2 to 6, representing:
- Makes things worse
- No effect
- Creates a small benefit
- Creates quite a lot of benefit
- Couldn’t be better
The bias remains towards benefit, although as for RSP, the results capture negative effects more than adequately and conform to the intuition of experts. Therefore we see no need to change the schema at this stage.
Field gradation across the range varies from 4 to 7, as appropriate for each criterion.
Since all the hard-lifting had already been done in the RSP and WFUE analysers, developing the RLP tool wasn’t that hard. There are still some rough edges, even to the extent of knowing what criteria can be represented by truly valid data sources. One or two are shown up in the results as conditional and either require a lot more work, or they’re not really relevant for the current task and should be deleted. A wider range of real case studies to work on would be useful for fine-tuning the value boundaries of the field gradients. Whatever, we think even this beta version offers a great deal of value in its ability to demonstrate how site and building design either diminish or enhance the value of the rest of the subdivision.
- Design methodology for Lot quality analysis
- Design schema for data generation
- Create geometry structure
- Build tool with internal data processing and output formats
Project Value:
n/a
Value of Services Provided:
n/a
Added Value:
- Design tool for lot configuration at any scale
- Assessment tool for proposed development


