2022
Residential Subdivision Performance Tool
Client: Common Ground
Urban designers will, generally, be able to tell whether a design is good or bad. But ask them ‘how’ good, and you’ll get a hundred different answers. An ‘I don’t know what’s Art, but I know what I like’ sort of thing. The RSP tool aims to knock that kind of vaguery on the head. Using solid, reputable urban design research, it ‘measures’ design quality at the subdivision level.
Read More
Technically, there are two big problems when it comes to objective analysis of quality. First, what is it that you actually measure, and second, how do you calculate its value.
There is a great deal of solid urban research, much of it undertaken over the last 30 years, that predicts performance outcomes in urban environments. Since the 1960’s we’ve known how many times per week a household will use a public open-space area depending how far away their front door is. We know what things people value in transit routes, and what time/distance penalties they choose depending on route quality. We know the percentage occupancy of a space required for people to feel comfortable using it. And so on. Any research finding that can be associated with geometry and spatial relationships can be used as an assessor.
The second technical problem has been harder to crack. Previously, the issue with using the research above in a systematic way was the sheer complexity of how all the various elements interact with each other and alter each other’s behaviour. Our breakthrough has been the recent valuation schema developed in the WFUE (Well-Functioning Urban Environment) modelling research. This has now opened the pathway to the development of many smaller-scaled analysis tools.
As in most matters, attention to scale often clears the air. What is ‘good’ urban design in a dense metropolitan environment can have disastrous effects in a residential suburb, a peri-urban area, an Italian hill-town, and so on.
RSP assessment – it’s in the name – only uses criteria relevant to operate at the level of residential subdivision, what we normally think of as suburbia. The core modeller can be easily repurposed for Mixed-use, City-centre, et al (MUSP, CCSP, etc) by using criteria and relevant research backed evaluation for those urban environments. What modelling at this scale doesn’t do (although it’s aware of them) is measure the interactions between adjacent land-use areas. Doing that is the purpose of wider-scale analysis using WFUE evaluation.
However, the RSP Tool shares a lot of DNA with the WFUE modeller. The RSP criteria are only finer grained (scaled) versions of WFUE criteria, with the valuation schema working in the same way to return overall ‘ranking’ values that are robust and intuitively validated. Uptake of WFUE modelling is slow as it involves significant investment in a baseline current state assessment (CSA). Only one CSA for a larger urban area has been done to date (2026) in Aotearoa. Using the RSP tool on a small, average part of that settlement returned a similar result to the WFUE model, demonstrating that RSP analysis may be a valid proxy – within certain limits – to indicate general urban functionality for the whole.
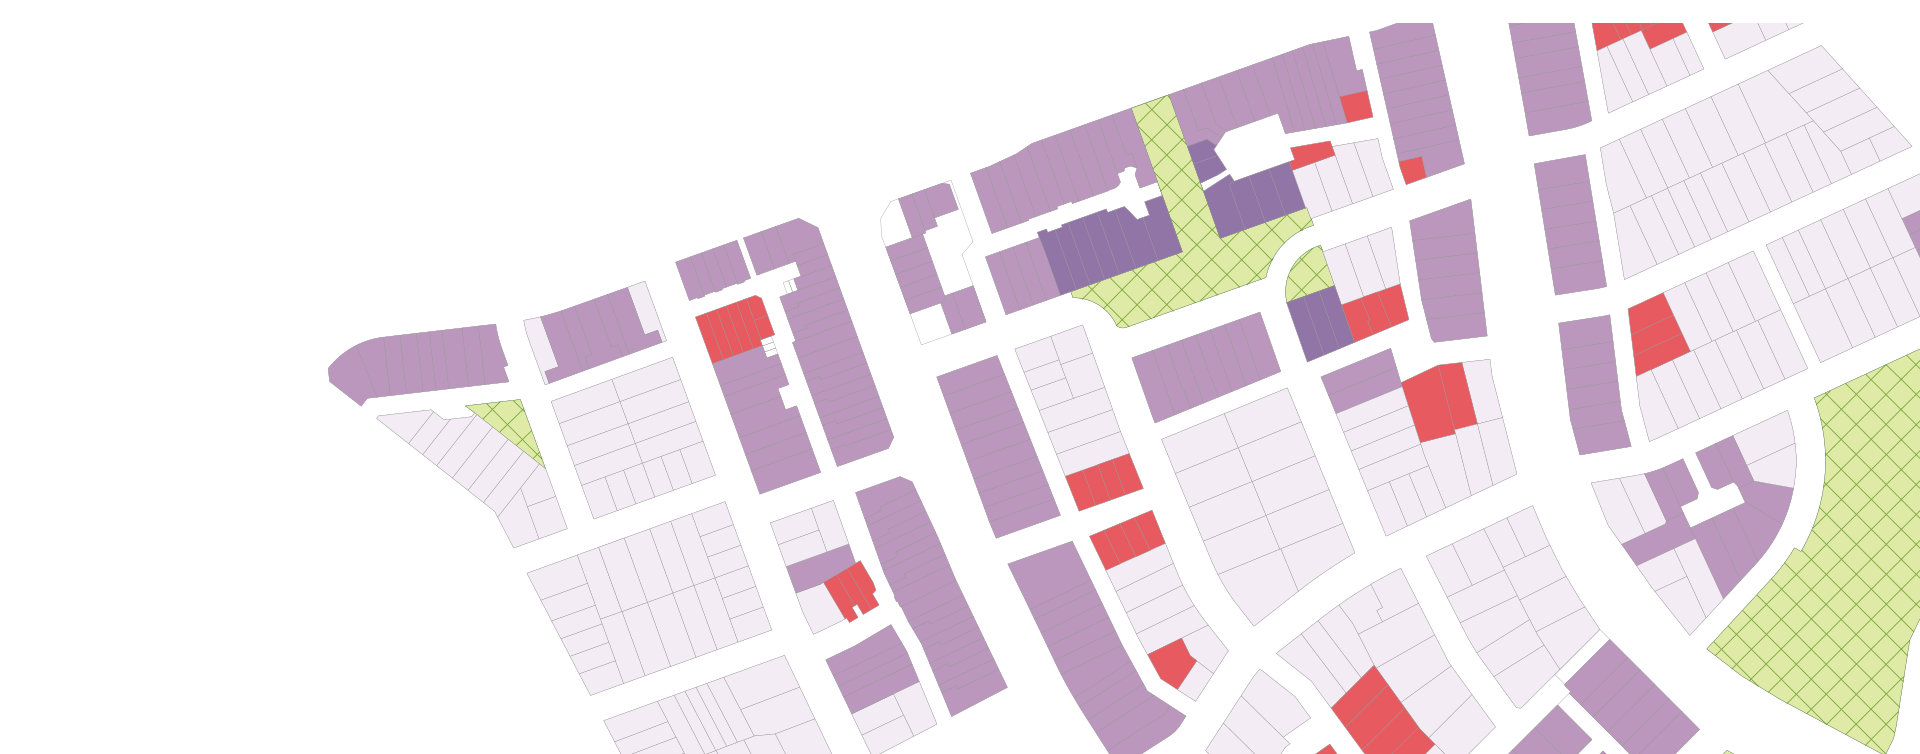
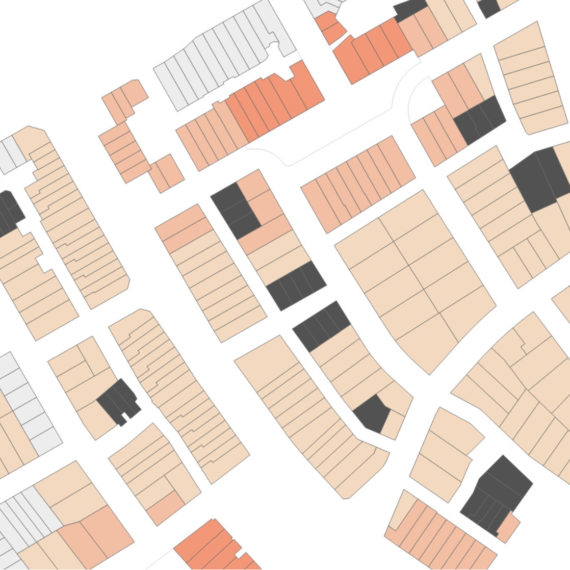
The internal working of the tool uses data records attached to various bits of geometry. Ten data fields are currently used, field values in most cases returned directly from object properties within the software environment. In a few cases extra geometry needs to be added, though it’s anticipated future iterations of the tool could automate this function. Data processing occurs within the tool to normalise the results, final values being expressed out of 100.
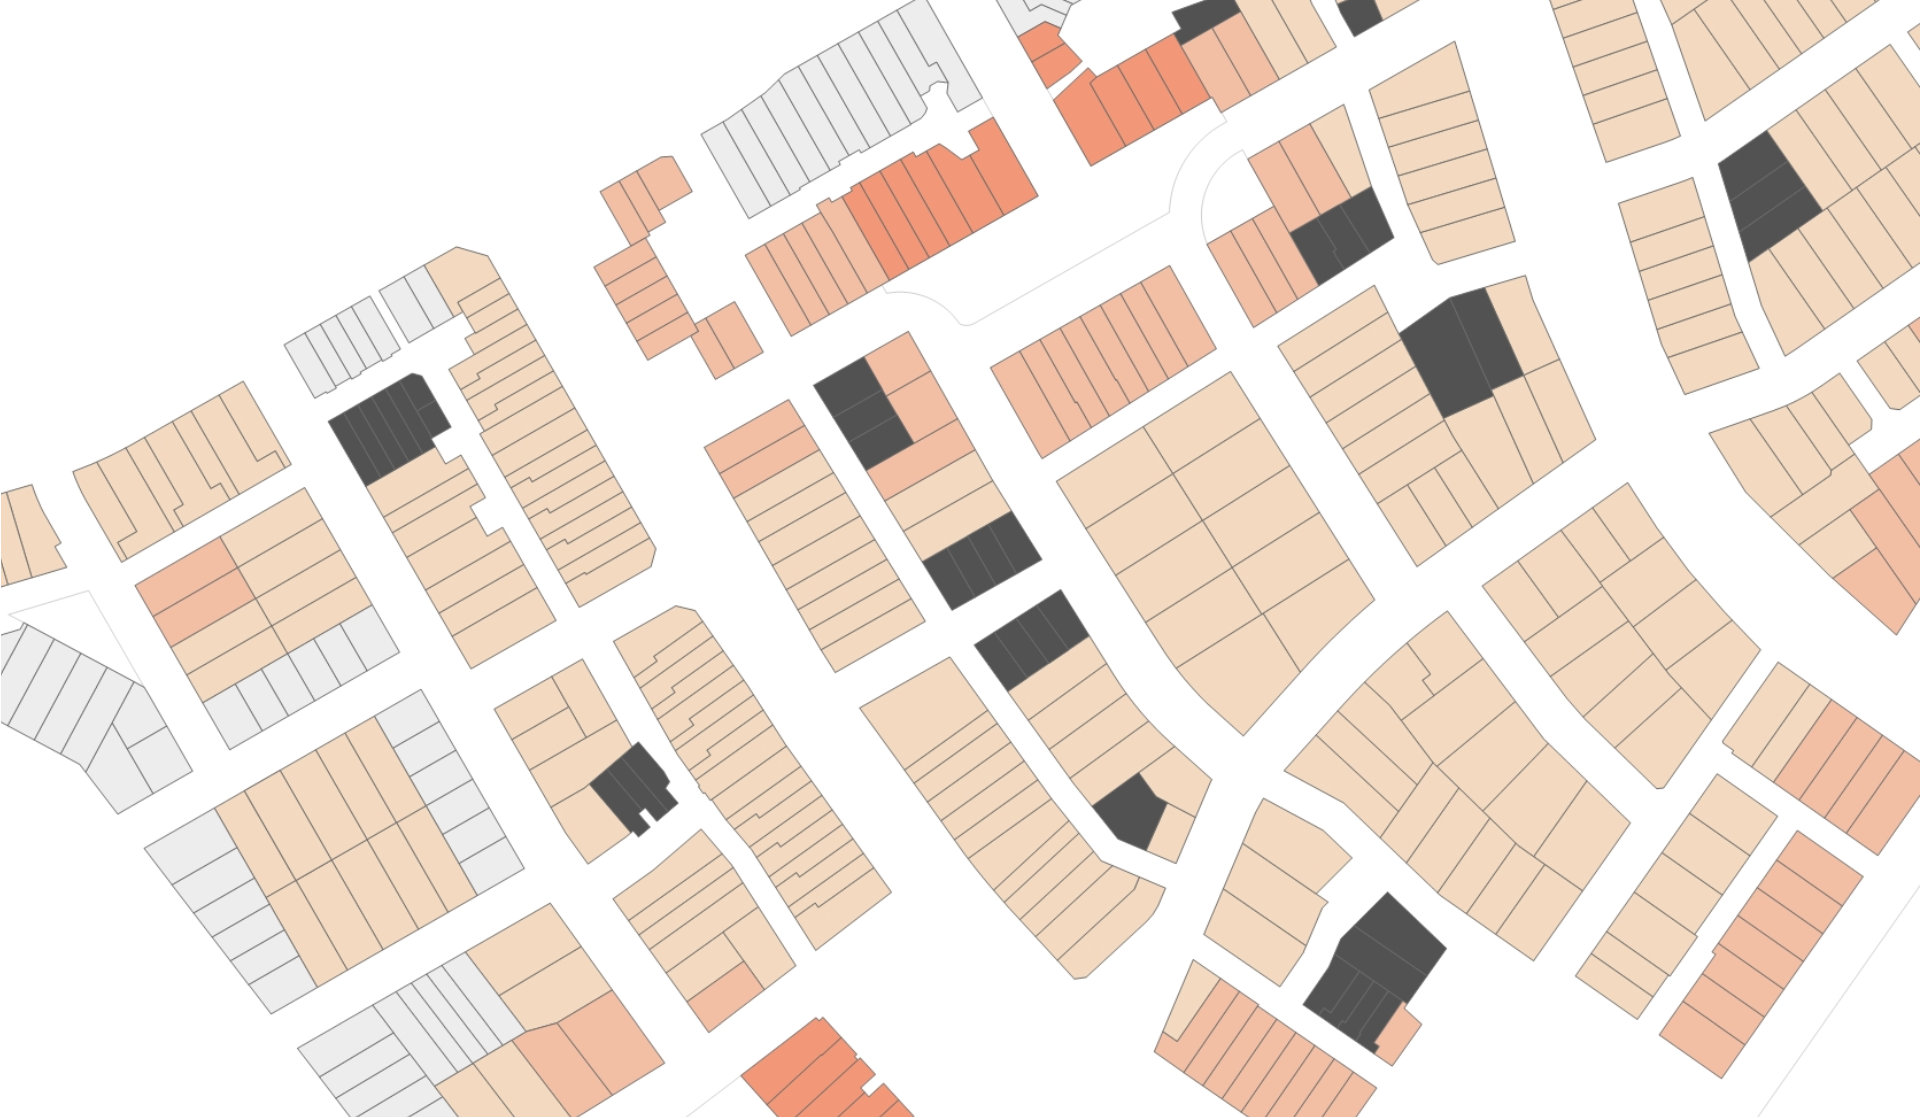
Data visualisations are produced for each criteria (field function). Individual and composite data views map urban functionality showing clearly where, and by how much, each part of the design is working. An overall performance score is also calculated for the whole subdivision.
Of limited use in the current iteration of the tool is movement network mapping and analysis, though it does expose where and how the underlying structure of the subdivision drives quality advances.
A subset of the data visualisation sets for two areas are shown below. Both are from Waiuku. The first is of an exemplar scheme, the subject of a recent plan change to accommodate the next tranche of residential growth in the town. The second is of a similar sized (about 30ha) existing ‘traditional’ subdivision that contains a similar amount of open-space. The visualisations and assessments make clear the difference in quality and performance (but not cost) when good design practice is applied.
- Research
- Data Structure
- Evaluation Methodology
- System Design and Construction
- Documentation
Project Value:
n/a
Value of Services Provided:
n/a
Added Value:
- Catalyst for higher quality urban form
- Objective analysis for Court use
- Design tool for design quality real-time feedback
- RSP Plansets
- Assessment Reports
- Urban Design guidance
- Development evaluation
- Documentation for council/community consultation


